Data are useless, or rather data itself are useless to a person.
The comparison “Data is today’s oil” is quite apt. The tempting thing about oil is that it can be used for many purposes—for example, to power cars. What would oil be for, though, if there were no industrial processes for its manufacturing or products that use it? It’s the same with data, they start to get interesting the moment they become the driving force of a specific product, such as a report, visualization or a website. Data are a raw material.
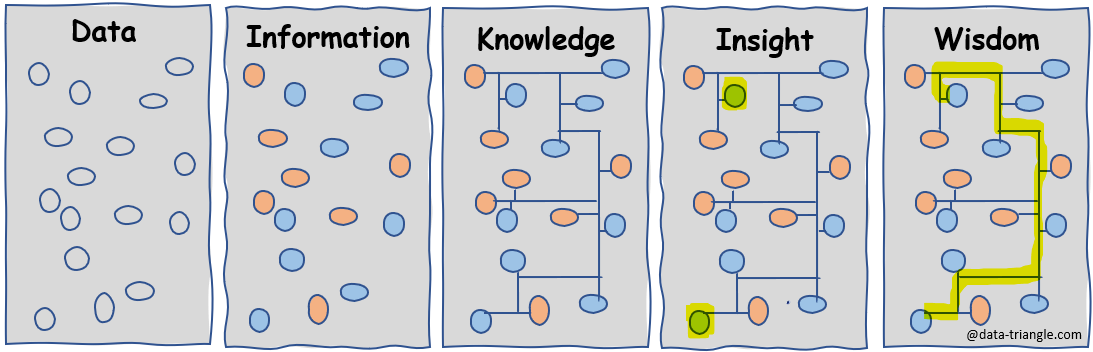
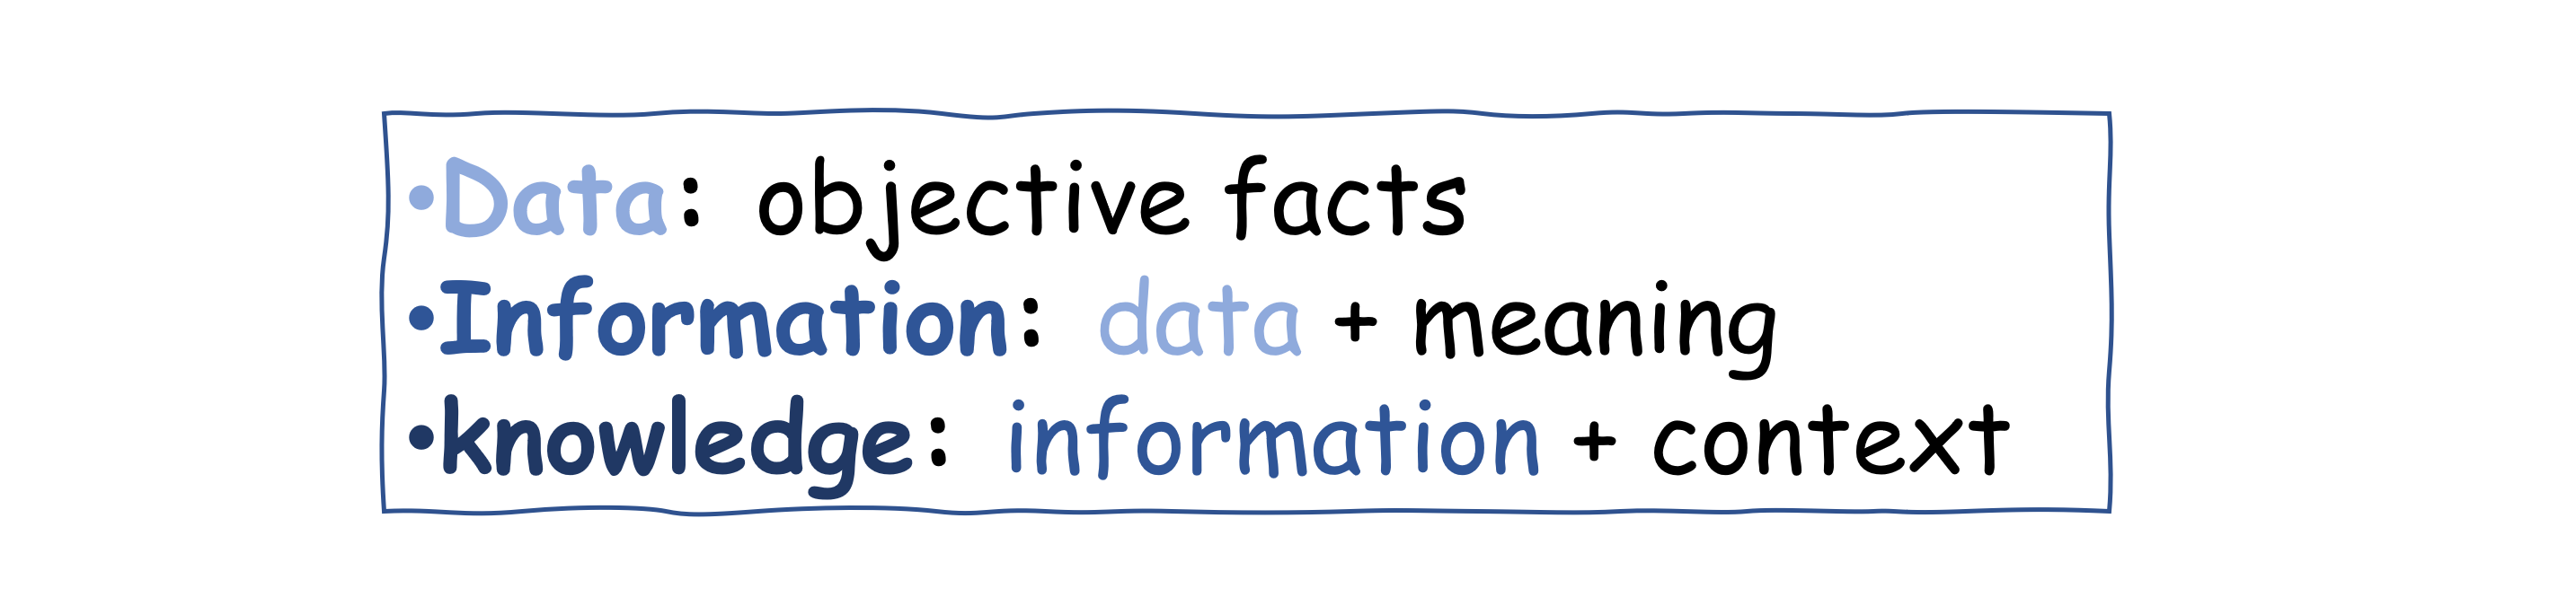
Thus, having a large amount of data is a prerequisite for success, not success itself. Data are objective facts. By giving them specific meaning, we gain information. For example, the objective fact that a circle is red does not carry any specific information until we give it a specific meaning: A red circle indicates danger, or a red circle indicates America on the Olympic flag.
Benefit from Data
We now know that the red circle indicates danger. However, if we do not know where the red circle is and for what purpose it was located there, this information is not exactly satisfactory. We can make a lot of assumptions based on our own experience. Some may be correct, others may not. The moment we add context to the information, we gain knowledge. For example, we find out that the red circle is a symbol for stopping at a traffic light. At this point, we get the first benefit from the data.
Translated into data analysis practice, this means that in order to benefit from the data, we need to understand them. This usually requires two groups of people. The first group understands the form of the data. They can separate squares from circles and organize them into categories. The second group understands their content. They know that if it’s round and red, it’s probably dangerous. You may have already guessed that these two groups are IT and business. When these groups join forces, we gain knowledge.
Practical Example
Let’s leave our example of a traffic light and replace it with another knowledge, this time from business reality. We have found that during our billing process, an invoice goes through an average of 12 states. This is our knowledge we have gained by processing data from our database. The IT data team processed the data from the two source systems through which the invoices pass and created a compact output from the time logs in the form of a table (they put together all the squares). The business has provided an understanding of what an invoice is and in which systems it is processed. The information itself, that an invoice passes an average of 12 states, does not directly indicate whether it is too much or not enough, whether most invoices have passed 12 states, or if there are invoices that have passed one state and invoices that have passed 30 states. And if there are invoices which have gone through only one state, what distinguishes them from others? The moment we are able to get answers to these questions, we gain insight into the problem.
From isolated logs in source systems (data), we gain an understanding of how invoices go through the process from issuance to payment, how many reminders are sent and what are the most problematic groups in terms of time and effort. We have a good insight into the data, on the basis of which we can take specific actions. We can optimize our billing process for specific customer groups, relocate the resources involved, and ultimately increase profits. If we connect the individual findings correctly, we become a little smarter, or wiser, if you prefer.