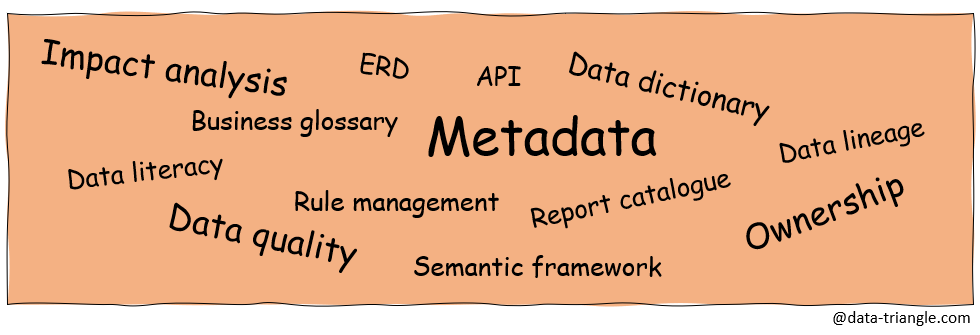
What is a Metadata Management Solution (MMS) and why do we actually need it? Logically, we have to start with metadata. Metadata is information about other data. Metadata helps us find data, organize it better and understand it. I dealt with metadata in more detail in the post here. MMS provides a set of functionality for storing, managing and controlling enterprise metadata.
Although the MMS functionality is not strictly defined for individual roles, it makes sense for me to divide the individual functionality according to their primary users (often also the creators). MMS users are recruited from several groups and are individuals who feel the need to work with metadata in some way. The first group is data analysts, data engineers and other technical roles who work with company’s data. Let’s summarize the second group for simplicity under the data governance initiative within the company (covered for example by the CIO). The third group, which may not feel the need to work with metadata, but a working MMS will be useful to them, are business users.
MMS users
- Data-oriented roles in IT
- Data governance initiative
- Business users of company data.
Data Analyst Perspective
When describing individual functionality, I will start with a data analyst view, which is closest to me. When creating and managing reports and other analytical outputs, one faces a number of problems that MMS can help with.
Data dictionary
A report assignment does not often accurately specify the data that the report should contain. For example, product-specific data may be available in several different places in several different tables. In order to know which table to use, we need to have a more detailed information of what the table contains. The data dictionary should contain more detailed information about the individual tables and their columns. The better the information about the data, the better we are able to use it when creating a report, or lead a discussion with the client.
Entity Relationship Diagram (ERD)
If we work in a relational environment, the ERD diagram is a key source of information about the relationships between objects. In a database, it is a database model. It gives us information. For example, to get the name of the department which each employee works in, we must link the department table to the employee table based on the department number. It defines primary and foreign keys within tables and relationship cardinality.
Data lineage
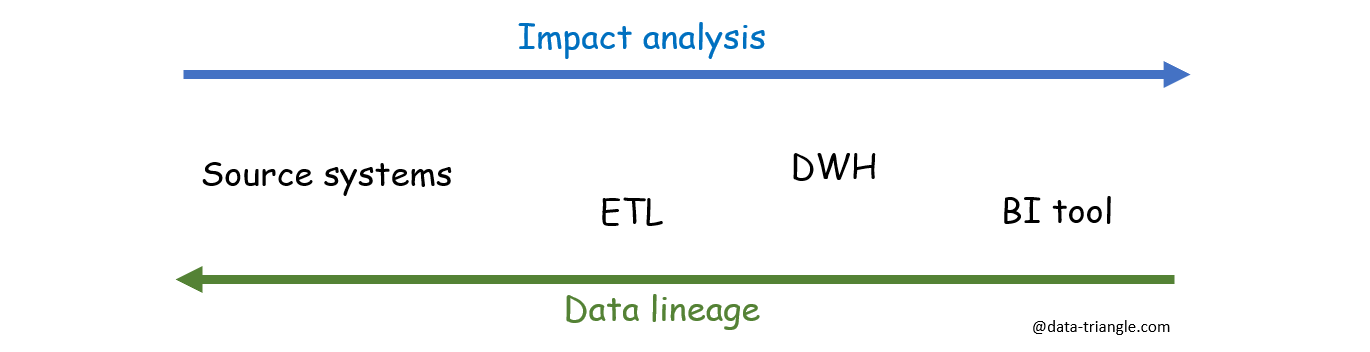
When creating reports, it is necessary to have an overview of where the data used in the report originates from. In report, for instance, we use the sales table, which we obtained by combining the payment table and the customer in our data warehouse (DWH). Tables used were copied to DWH from source systems—accounting, or rather CRM. The report should mention from which source system the data is taken, or what calculations were created over them. We will also use the knowledge about the origin of the data at the moment when someone questions the data in the report. We are able to trace the data back to the source and verify their accuracy. This MMS functionality is called data lineage.
Impact analysis
One of the most important pieces of information for database administration and the modification of existing scripts is what impact a specific modification will have. For example, a change of the column name in an existing table, or a restriction within a specific script. Before making a change, we need to have information on which objects are linked to a specific change. For example, edit of a column name in a table which is used by a view, which is further used in three reports on two BI visualization platforms. Unlike data lineage, which traces a particular object back to the source, the logic here is reversed. Impact analysis gives us information about which objects will be affected by the change on the source.
The first two described functionalities are relatively easy to implement and are part of most MMSs. Implementation of data lineage and impact analysis, on the other hand is much more complex. MMS must contain connectors to all source systems, databases and BI tools. This is usually a combination of manual and automated recording.
Data Governance Perspective
The data governance initiative should, of course, take into account all the functionality of MMS and be its primary administrator. Everything is related to the quality and security of the data. Overall, in perspective of the data governance team, it is difficult to describe individual functionality because it is spread across the entire IT ecosystem. Let’s look at at least two, which are often mentioned by the MMS vendors.
Data quality
Securing data quality at the entrance to source systems is essential for any other meaningful work. Source systems should be set up to generate data in a consistent manner and in the expected format. It also makes sense to introduce data quality controls, which would be defined in the relevant MMS module.
Rule management
Rule management is a broad category that includes internal policies, requirements and rules that should be further applied in applications and systems.
The Perspective of the Business User
Like the previous two groups of users, a business person who is not otherwise involved in data analysis or management can also create MMS content. MMSs are often designed to serve business users as well. When properly implemented, the user in the MMS should find answers to most questions that relate to company data—internal policies, instructions, information on available reports and other data analysis, the exact definition of terms. At the same time, business users should be able to ask questions, for example, about existing reports, propose definitions of business terms, etc.
Business glossary
The business dictionary should contain all terms that are actively used within the available reports and data sets. Although the notion of client or customer may seem elementary, their understanding across departments may vary diametrically. Interpreting the data from the individual reports could then be misleading.
Report catalog
A useful functionality for end users is also a catalog of all available reports and other data outputs. MMS should allow the user to easily navigate through the available reports and choose the right one for their purpose. It should also contain information about the report creator, creation date, last update, etc.
MMS Vendors and the Price
There is a large number of MMS vendors on the market. For example, Gartner’s Magic Quadrant can be used for initial orientation. Gartner, which, among other things, deals with benchmarking studies, includes in its selection only vendors who meet all the above-mentioned functionality (for example, Informatica, Collibra). Implementing MMS on the enterprise level is usually a relatively expensive and demanding initiative. Most MMS vendors are also implementers and the price of the solution varies according to the size of the company and the scope of the solution—from higher tens to hundreds of thousands of USD per year. However, there is also a number of smaller vendors that provide only part of the functionality (Dataedo, OvalEdge). Their solutions can be purchased from units of thousands of USD per year.
If we don’t want to invest in expensive MMS solutions that target the entire company globally, we can start with metadata management at the level of a specific application. For example, ERD models, described data and definitions of business terms. Although this does not give us a general overview across applications, it is still a good insight into our data.