Once in a while one comes across a project which has a simple assignment and obvious justification in business world but it is still challenging to transform into technical solution. Use case described below is a good example how to work with specific time periods in Power BI. Even though the week is not part of a standard date hierarchies and Power BI doesn’t offer week-based time intelligence functions, we can create solutions based on week breakdown. It will just require more use of DAX.
Assignment
Company analyzes its KPI performance in the following weekly cycles.
- Last 2 weeks
- Last 4 weeks
- Last 12 weeks
- Last 24 weeks
- Last 52 weeks
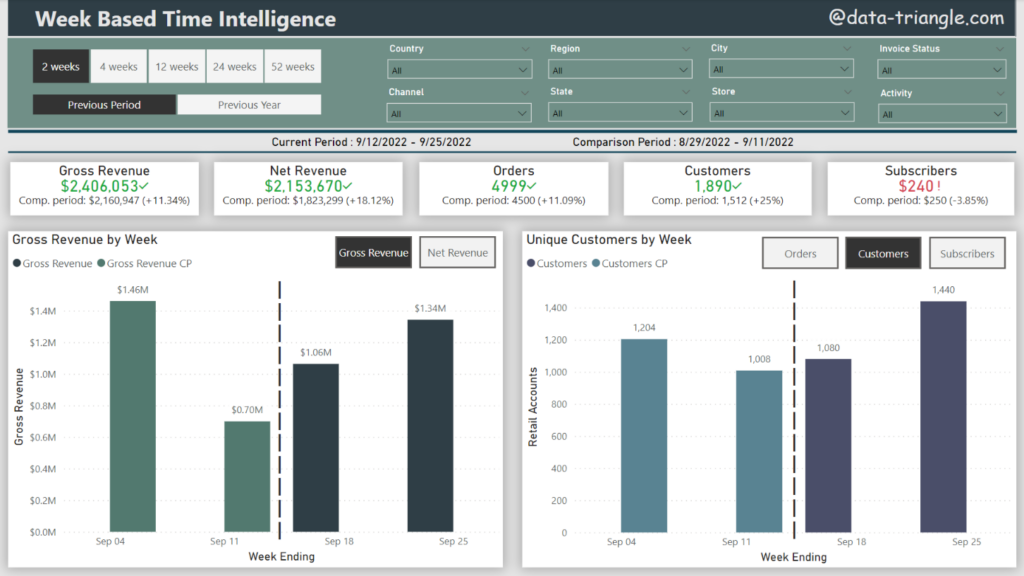
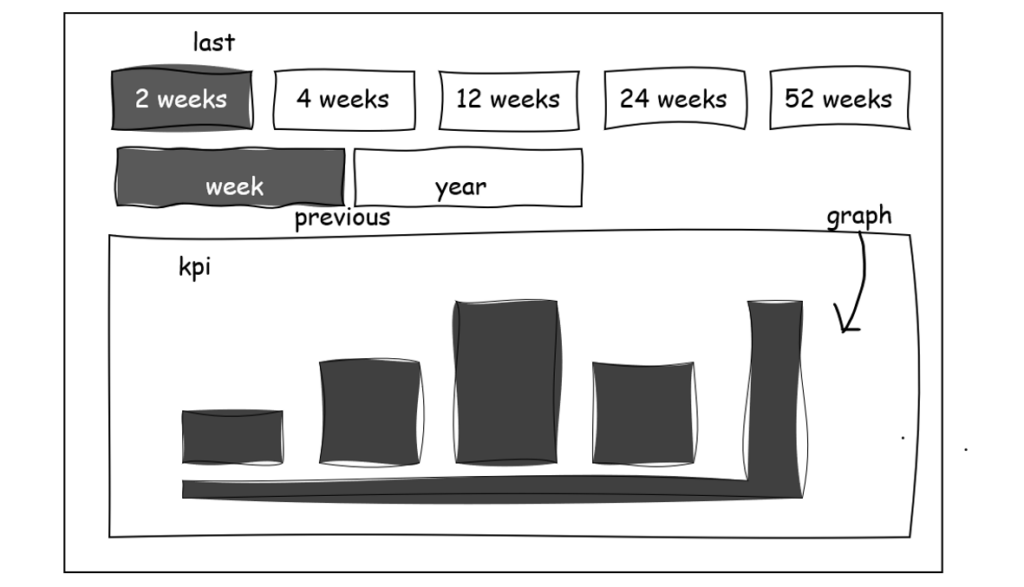
Assignment is to build a report which shows the actual performance based on selected cycle with comparison to previous cycle, i.e., last two weeks compared to two weeks before. In our example current period 12th September – 25th September 2022 is compared to 29th August – 11th September 2022.
note: periods are defined by Sunday as a week end
At the same time, it is required to be able to switch between previous period and the same period previous year. In our example it would be the same period previous year 12th September – 25th September 2021. To build a functional solution I had to go through several challenges. First one is obvious right away – week is not a part of date hierarchy.
Week aggregations

Week is not a part of standard day -> month -> quarter -> year hierarchy in DAX. There’s no build-in WEEK () or PREVIOUSWEEK() function in DAX either. First challenge is to define last and second to last calendar week. There are for sure more solutions to this problem. I decided to use the combination of TODAY() and WEEKDAY() functions where I subtracted week day number from actual date to get end of previous week (last Sunday). Second parameter in WEEKDAY function defines that last day of the week is Sunday.
Last Week Sunday =
TODAY () - WEEKDAY ( TODAY (), 2 )
Subtracting 7 from the formula we get the first day of our week which is Monday.
Lastd Week Monday =
TODAY () - WEEKDAY ( TODAY (), 2 ) - 7
Now we have first and last day of the week which is defining our period. Based on this period we can filter the fact table. We have to include RELATED function since we want to filter out the fact table containing KPI numerical values based on dimension date table. In DAX below we defined actual (last week) period which is the cornerstone for the following steps.
VAR filterperiod temp =
FILTER (
    fact_table,
    AND (
        RELATED ( Dim_Date[Date] )
            <= TODAY () - WEEKDAY ( TODAY (), 2 ),
        RELATED ( Dim_Date[Date] )
            > TODAY () - WEEKDAY ( TODAY (), 2 ) - 7
    )
)
Last Versus Second to Last

In previous step we defined calendar week period. Now we are able to aggregate data on weekly basis and calculate our KPIs. From the logic of formula below it is obvious we can modify the period by simply subtracting multiples of 7. For how to get the last two calendar weeks (our actual period cycle) see DAX below.
From our example
Current Cycle: 12th September – 25th September
AND (
    Dim_Date[Date]
        <= TODAY () - WEEKDAY ( TODAY (), 2 ),
    Dim_Date[Date]
        > TODAY () - WEEKDAY ( TODAY (), 2 ) - 14
)
Previous Cycle: 29th August – 11th September
AND (
    Dim_Date[Date]
        <= TODAY () - WEEKDAY ( TODAY (), 2 ) - 14,
    Dim_Date[Date]
        > TODAY () - WEEKDAY ( TODAY (), 2 ) - 28
)
It is obvious we need to multiply 7 by variable
Dim_Date[Date]
    > TODAY () - WEEKDAY ( TODAY (), 2 ) - 7 * variable
Switch Between Cycles
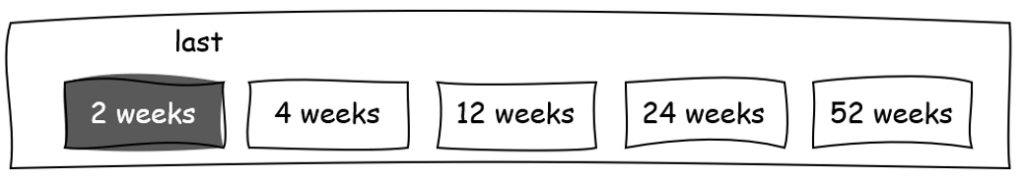
We defined cycle calculation, but how to allow user to switch between cycle length? My solution consists of three elements.
- Supporting WeekCycles table created in Power BI. This table contains two columns – cycle description and cycle ordering
- Slicer in horizontal layout utilizing values from supporting table
- Variable in DAX assigning week numbers based on the slicer selection
I used SWITCH function which is commonly used to define different execution paths depending on the condition of an expression. However nested IF can be used as well. Variable returns number of weeks in numeric format based on user selection.
VAR selectweek =
SWITCH (
    SELECTEDVALUE ( WeekCycles[Cycle] ),
    "2 weeks", 2,
    "4 weeks", 4,
    "12 weeks", 12,
    "24 weeks", 24,
    "52 weeks", 52,
    1
)
Previous Year Comparison

We are on the right track to achieve our goal. We have managed to prepare the date filter; we defined variable for switching cycle length. Now we have to enable user to choose comparison period. It could be eighter previous period or previous year.
The approach is the same as for the cycle length. We need a supporting table containing available options in string format which we assign to a slicer.
When it comes to the DAX variable, we need to think in context of what we have already built. Our filter function filters fact table based on start and end day period and returns us weekly cycles. selectweek variable provides us with dynamic to change the cycle length based on number of weeks. Now we have to add new variable which will switch between previous period and previous year. But what should be the return values?
VAR selectcomparison =
SWITCH (
    SELECTEDVALUE ( ComparisonOptions[Comparison Period] ),
    "Previous Week", '???',
    "Previous Year", '???'
)
Here it comes probably to the most challenging part of the solution. My assumption was that I need the both variables selectweek and selectcomparison in date filter created before. selectweek variable returns the number of weeks which will be converted to days (multiplying number by 7) subtracting them from Sunday to get previous weeks start and end date. Second variable needs to be used in similar way. Simply said, I need to define how many days to subtract from period start and end day to get dates for comparison period. The logic for previous period is already covered in selectperiod variable. No further action is necessary. The true challenge is the formula for previous year. I came with following formula which I need to subtract from my “last Sunday” in the filter.
365 - 7 * selectweek
Our selectcomparison variable is then as follows.
VAR selectcomparison =
SWITCH (
    SELECTEDVALUE ( ComparisonOption[Comparison Period] ),
    "Previous Week", 0,
    "Previous Year",
        365 - 7 * selectweek
)
It is probably not obvious right away, but after some testing we can see that this solution provides us with expected output. Translated to the words we are subtracting one year (365 days, abstracting from leap year complexity) and adding period based on selected number of weeks to mitigate previous period shift since we want to move on yearly basis now.
VAR filterperiod =
FILTER (
    fact_table,
    AND (
        RELATED ( Dim_Date[Date] )
            <= TODAY () - WEEKDAY ( TODAY (), 2 ) - 7 * selectweek - selectcomparison,
        RELATED ( Dim_Date[Date] )
            > TODAY () - WEEKDAY ( TODAY (), 2 ) - 7 * selectweek * 2 - selectcomparison
    )
)
Row Context
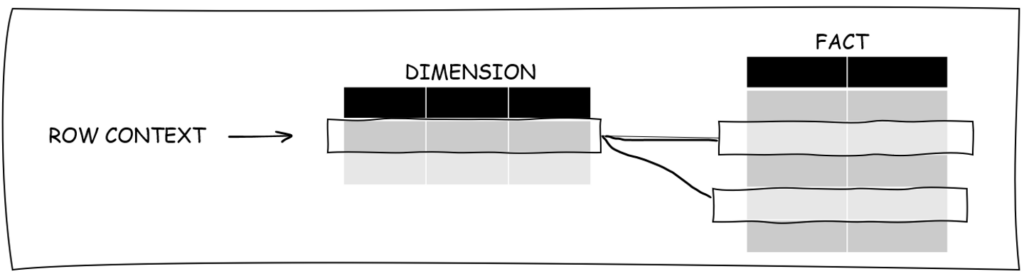
Great, we have created three variables in the following logical order selectperiod -> selectcomparison -> filterperiod and we are able to filter the fact table dynamically based on user’s slicer setup. Before we wrap the use case, I want to mention something which is not directly connected to Time Intelligence, but it is very important for our use case – we need to understand that we filter the fact table in row context. Therefore, we need to use iterating functions for KPI calculations. Example for revenue would be as follows.
Revenue =
SUMX ( filterperiod, fact_table[Revenue] )
This looks simple. But what if we want to calculate distinct count value, i.e. unique customers. DISTINCTCOUNTX function does not exist in DAX. However, workaround solution exists.
Unique Customers =
COUNTROWS (
    DISTINCT (
        SELECTCOLUMNS ( filterperiod, "DistinctCustomer", fact_table[CustomerID] )
    )
)
Putting all together
Now we have all the DAX components to create measures and visualize our KPIs. We need to create measure in relation to how we want to visualize the data. I want to visualize actual period with comparison period for given KPI in one visual. I also decided to split the visual in two parts, (actual and comparison) which requires two measures for each KPI. Below you can see the full DAX formula for Unique Customers Previous Period KPI calculation.
Unique Customers PP =
VAR selectweek =
    SWITCH (
        SELECTEDVALUE ( WeekCycles[Cycle] ),
        "2 weeks", 2,
        "4 weeks", 4,
        "12 weeks", 12,
        "24 weeks", 24,
        "52 weeks", 52,
        1
    )
VAR selectcomparison =
    SWITCH (
        SELECTEDVALUE ( ComparisonOption[Comparison Period] ),
        "Previous Week", 0,
        "Previous Year",
            365 - 7 * selectweek
    )
VAR filterperiod =
    FILTER (
        fact_table,
        AND (
            RELATED ( Dim_Date[Date] )
                <= TODAY () - WEEKDAY ( TODAY (), 2 ) - 7 * selectweek - selectcomparison,
            RELATED ( Dim_Date[Date] )
                > TODAY () - WEEKDAY ( TODAY (), 2 ) - 7 * selectweek * 2 - selectcomparison
        )
    )
RETURN
    COUNTROWS (
        DISTINCT (
            SELECTCOLUMNS ( filterperiod, "DistinctCustomer", fact_table[CustomerID] )
        )
    )
For actual period we don’t need selectcomparison variable and selectweek would be adjusted accordingly. Otherwise, the logic is the same.
We have everything needed to calculate required KPIs and create report visual.